In this article, I am going to describe my motivation for building an automated plant monitoring and I will explain my final system and results in detail.
If you do not care about the details, jump straight to the results.
Hardware
Xiaomi offers a simple and cheap flower sensor that can measure 4 different properties of a plant:
- soil moisture,
- soil fertility (aka. conductivity),
- brightness,
- temperature.
You can find more details here: https://xiaomi-mi.com/sockets-and-sensors/xiaomi-huahuacaocao-flower-care-smart-monitor
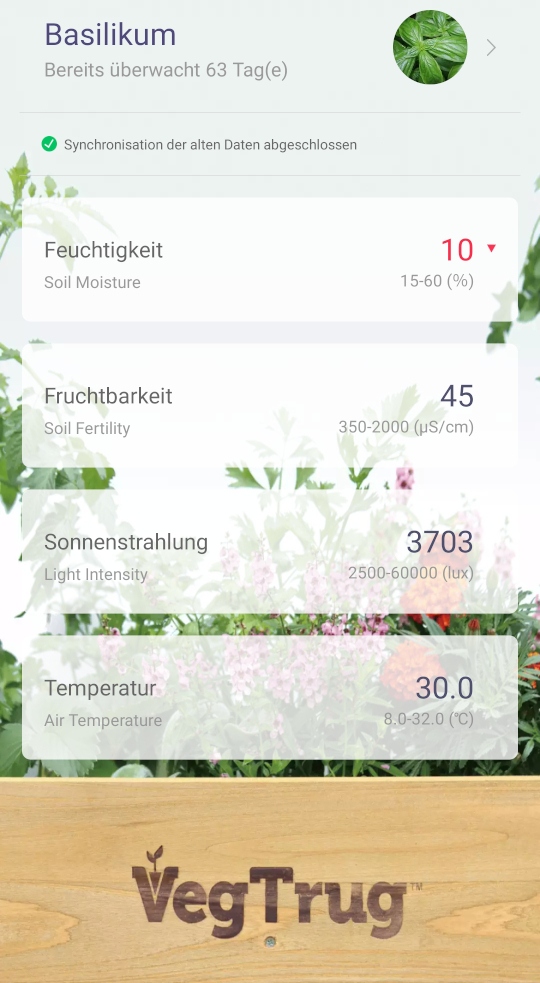
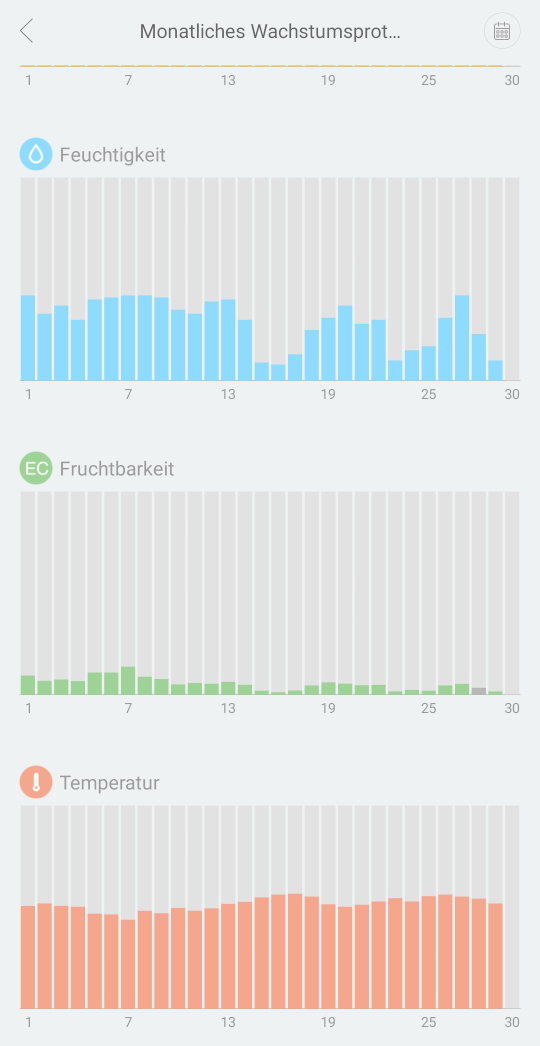
The VegTrug Grow Care app is compatible to these sensors and can connect via Bluetooth. It shows the current readings for the 4 available properties plus the battery level of the sensor. It is powered by a CR2032 button cell. The app even keeps historic data to show the trend over a day, week or month.


By design, an App-based solution has a few deficits. For instance, monitoring is only possible when the smartphone is in the range of a sensor. The app and smartphone have to be active as well, which is neither practical nor realistic. Alerting is not possible either.
Idea
Utilize some kind of local server to
- frequently connect to the Mi Flora sensors and collect the current sensor readings,
- process and store these values indefinitely,
- offer a flexible UI to play with stored data,
- alert if a predefined threshold is met.
Code
As the local server, I decided to use a Raspberry Pi 4 because it comes with integrated Bluetooth and WLAN support. Also, it offers more than enough computing power and storage for this purpose while still being cost-effective and energy-efficient.
miflora-mqtt-daemon
Fortunately, miflora-mqtt-daemon is a great project that is capable of connecting to multiple Xiaomi Mi Flora sensors to retrieve their current measurements and publish the result to any MQTT server. I found this project very easy to use and to work very well. Especially the README is great and very helpful.
Mosquitto
As the MQTT server, I decided to use Eclipse Mosquitto. It is easy to use and required no configuration for this simple use case. It acts as a message bus to which the miflora-mqtt-daemon can easily deliver the values it retrieved. Mosquitto will not store any data. If there is no consumer-available, the messages will be lost.
Telegraf
Telegraf is used to bridge the gap between Mosquitto as the message bus and InfluxDB as persistent storage. This tool is far more powerful than what I use it for in this project.
My Telegraf configuration is quite simple, it only defines MQTT as input and InfluxDB as output. Comments and other not relevant settings are not shown for the sake of brevity:
| |
InfluxDB
InfluxDB is a time-series database that works very well for use cases like this. It is often found in IoT projects, therefore I also used it here.
All the configuration that is required are the three environment variables set in the docker-compose file shown below, see Docker Compose.
With the components covered so far, the system is already capable of recording and storing the measured sensor readings.
Grafana
Grafana is a great tool to query data from different sources, such as InfluxDB. It allows to easily play with the data, different visualizations, and transformations. Furthermore, alerts can be defined on the raw data or based on calculations and transformations.
As described in the Results section, Grafana helped a lot to understand the different properties and to find an individual combination of transformations, visualizations, and a threshold for each sensor/plant.
Docker Compose
All services mentioned above are defined in a docker-compose file, except for the miflora-mqtt-daemon:
| |
Do not forget to set proper passwords!
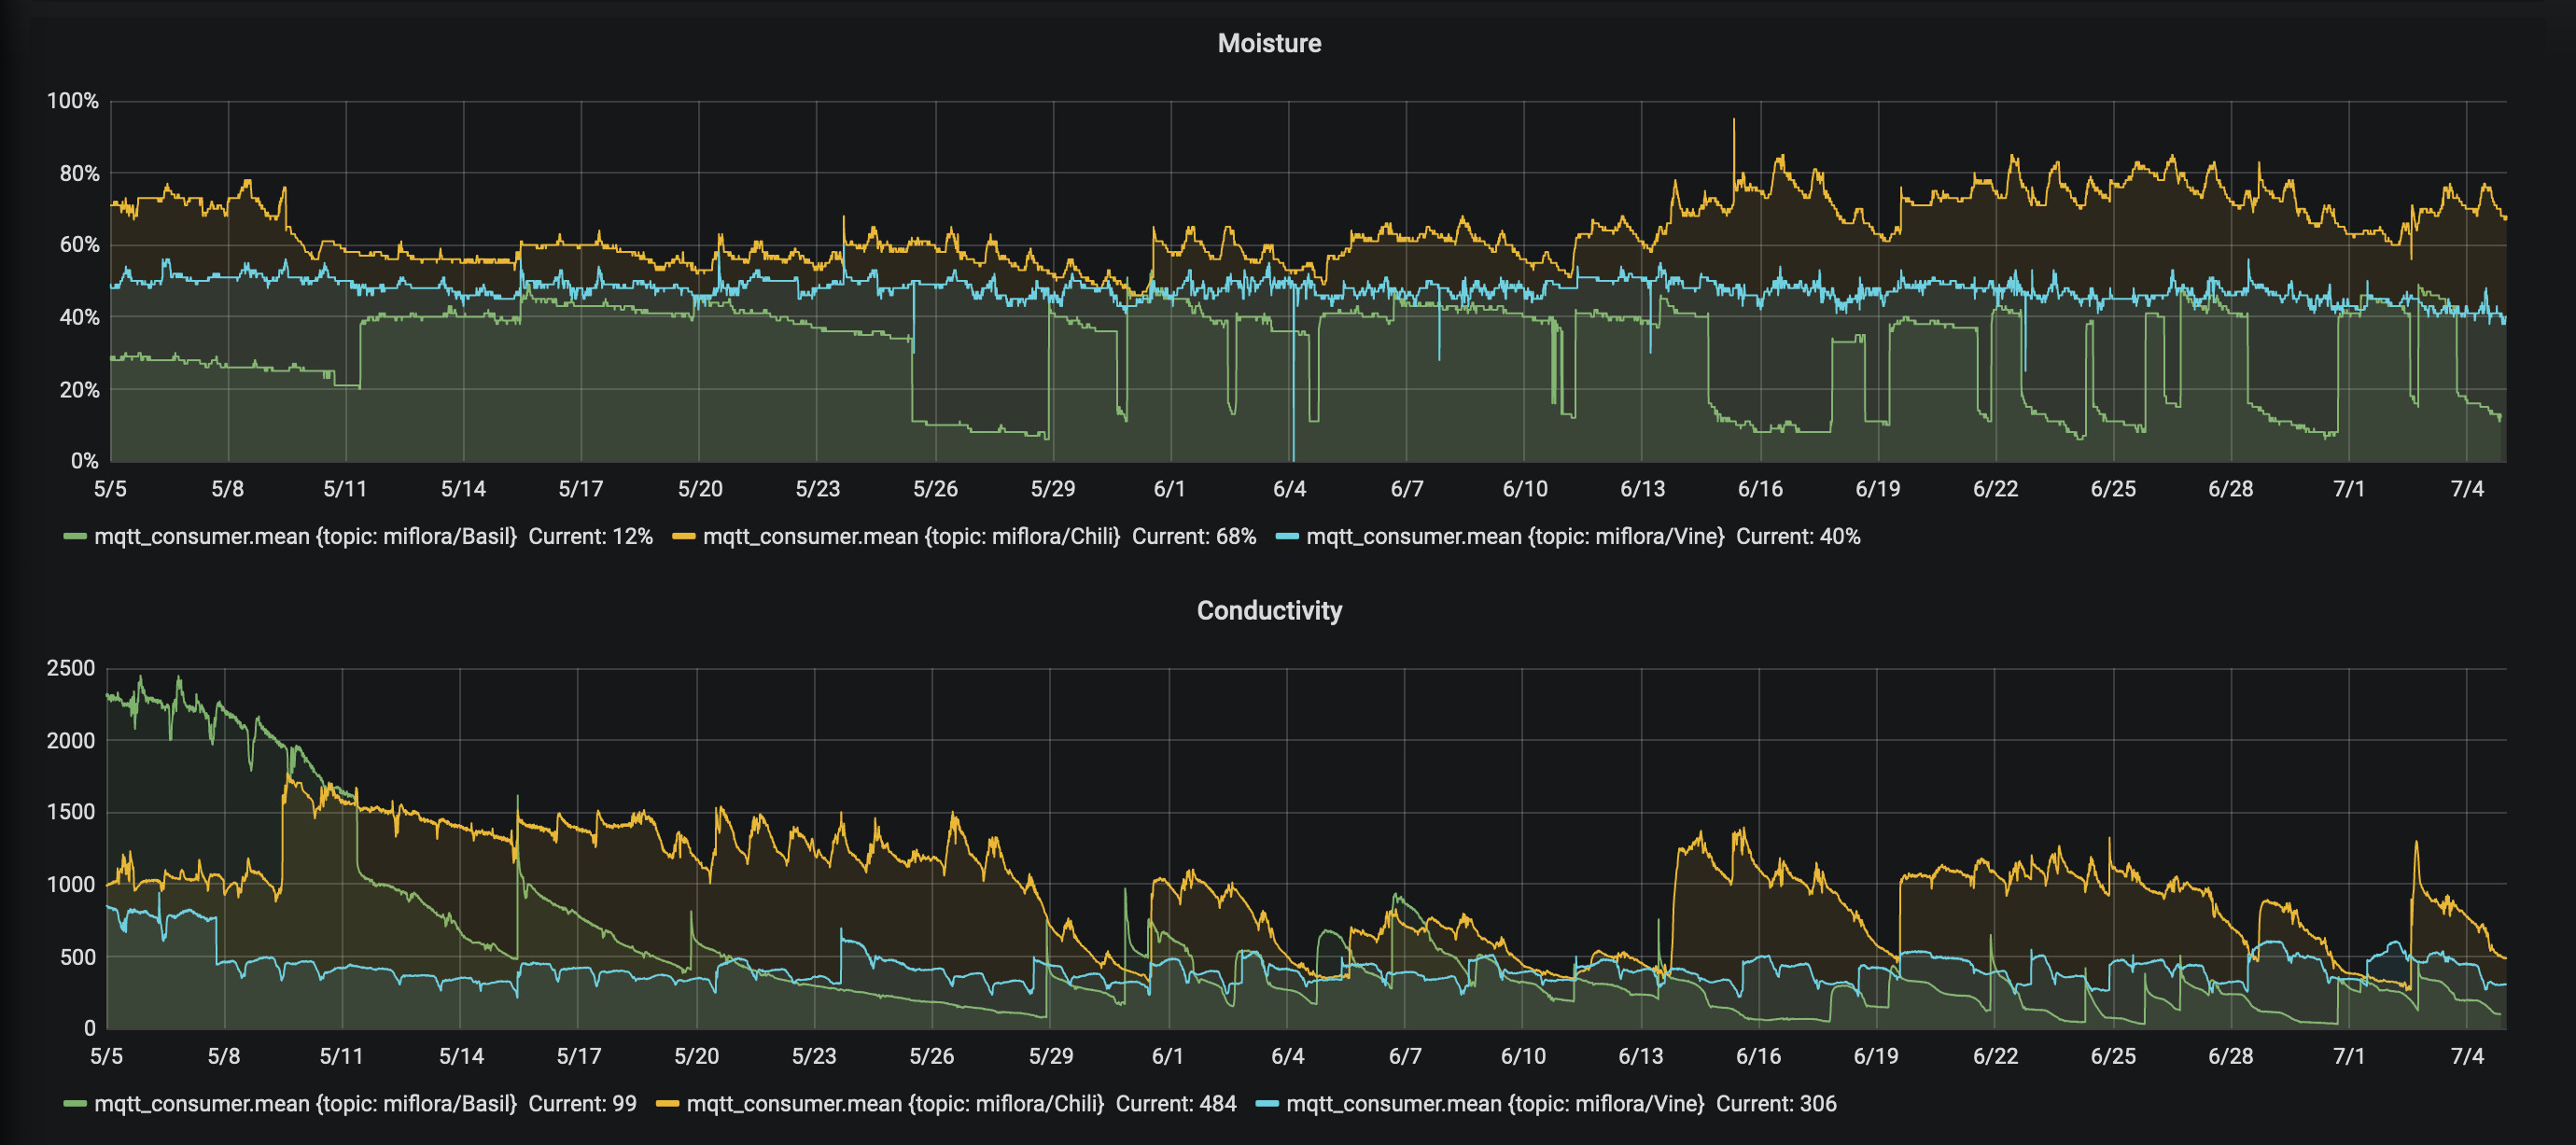
Results
At the time of writing this, the described setup is active for about 60 consecutive days without interruption: 3 sensors that are queried every 10 minutes to retrieve 5 numeric properties per sensor: temperature, light, moisture, conductivity, and battery level. The three plants I selected for monitoring are:
chili- A young chili plant that was located on my balcony in a balcony trough.vine- A vine plant that was also located on the balcony, but more protected from wind and rain because it is covered by a small roof.basil- A typical basil plant located next to the kitchen window.
Disk Space
The disk space required to store the collected data with InfluxDB is negligible, less than 30 MB.
After thinking about this for a second it is not so surprising anymore. Although 60 days seem like a long period, the amount of data collected is indeed not too much. If we assume that each measurement taken is stored as an Integer with 4 bytes we can calculate the number of bytes required to store each measurement: + 3 sensors * 5 measured properties * 4 bytes * 6 measurements per hour * 24 hours per day * 60 days = 518.400 bytes or roughly 0.5 MB. Of course, this rough estimation, for instance, completely ignores the timestamp that needs to be stored with each value.
Light & Temperature
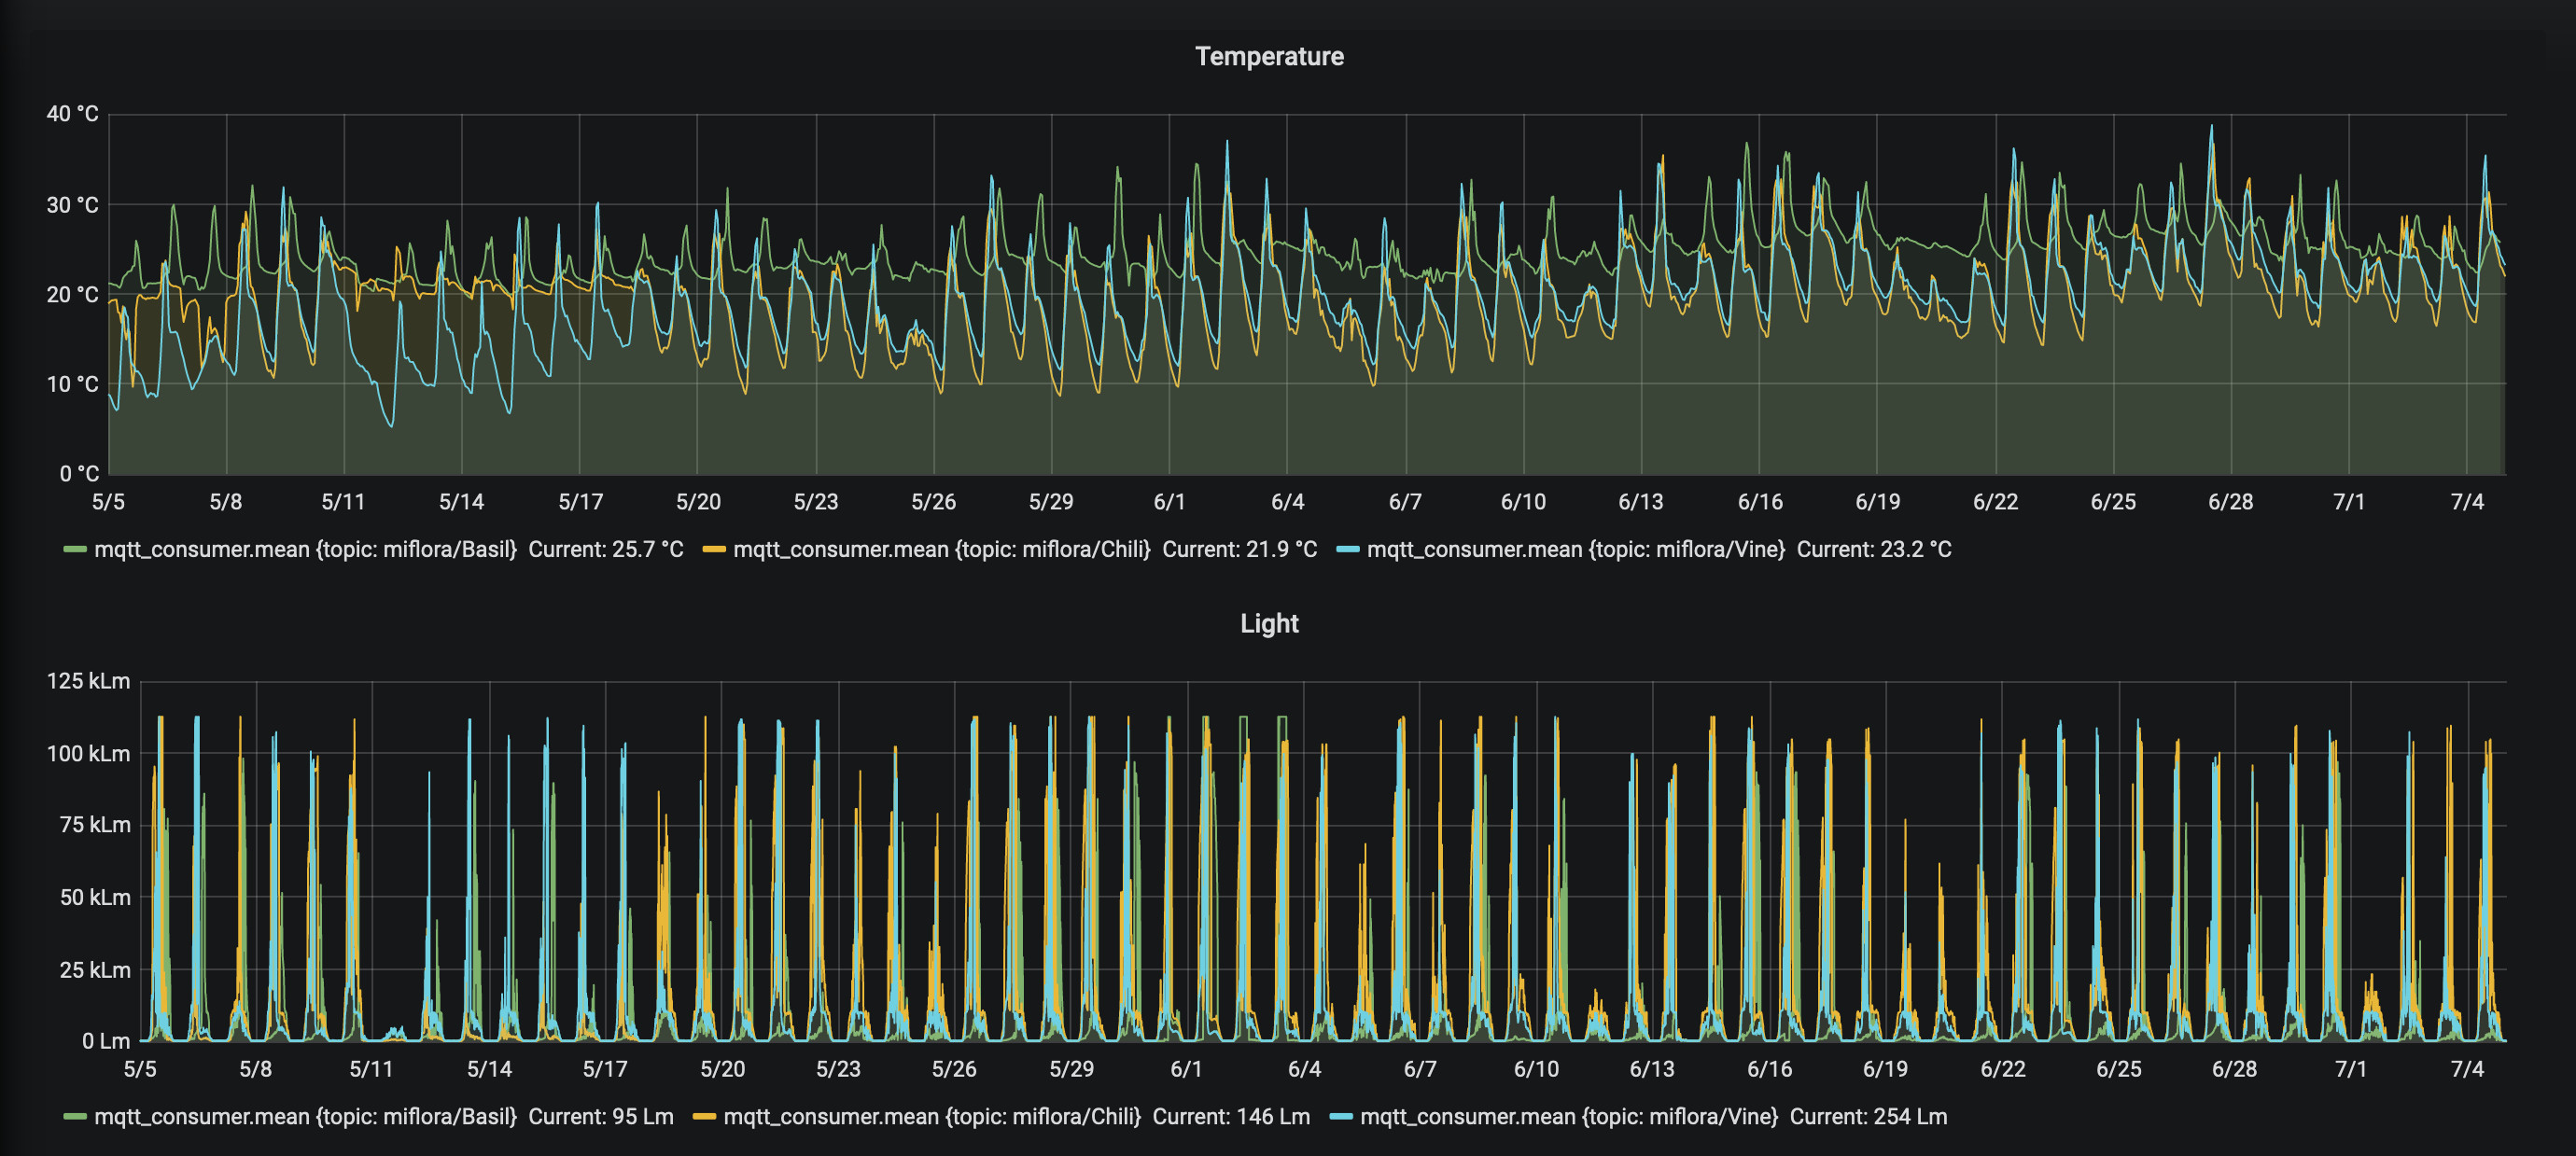
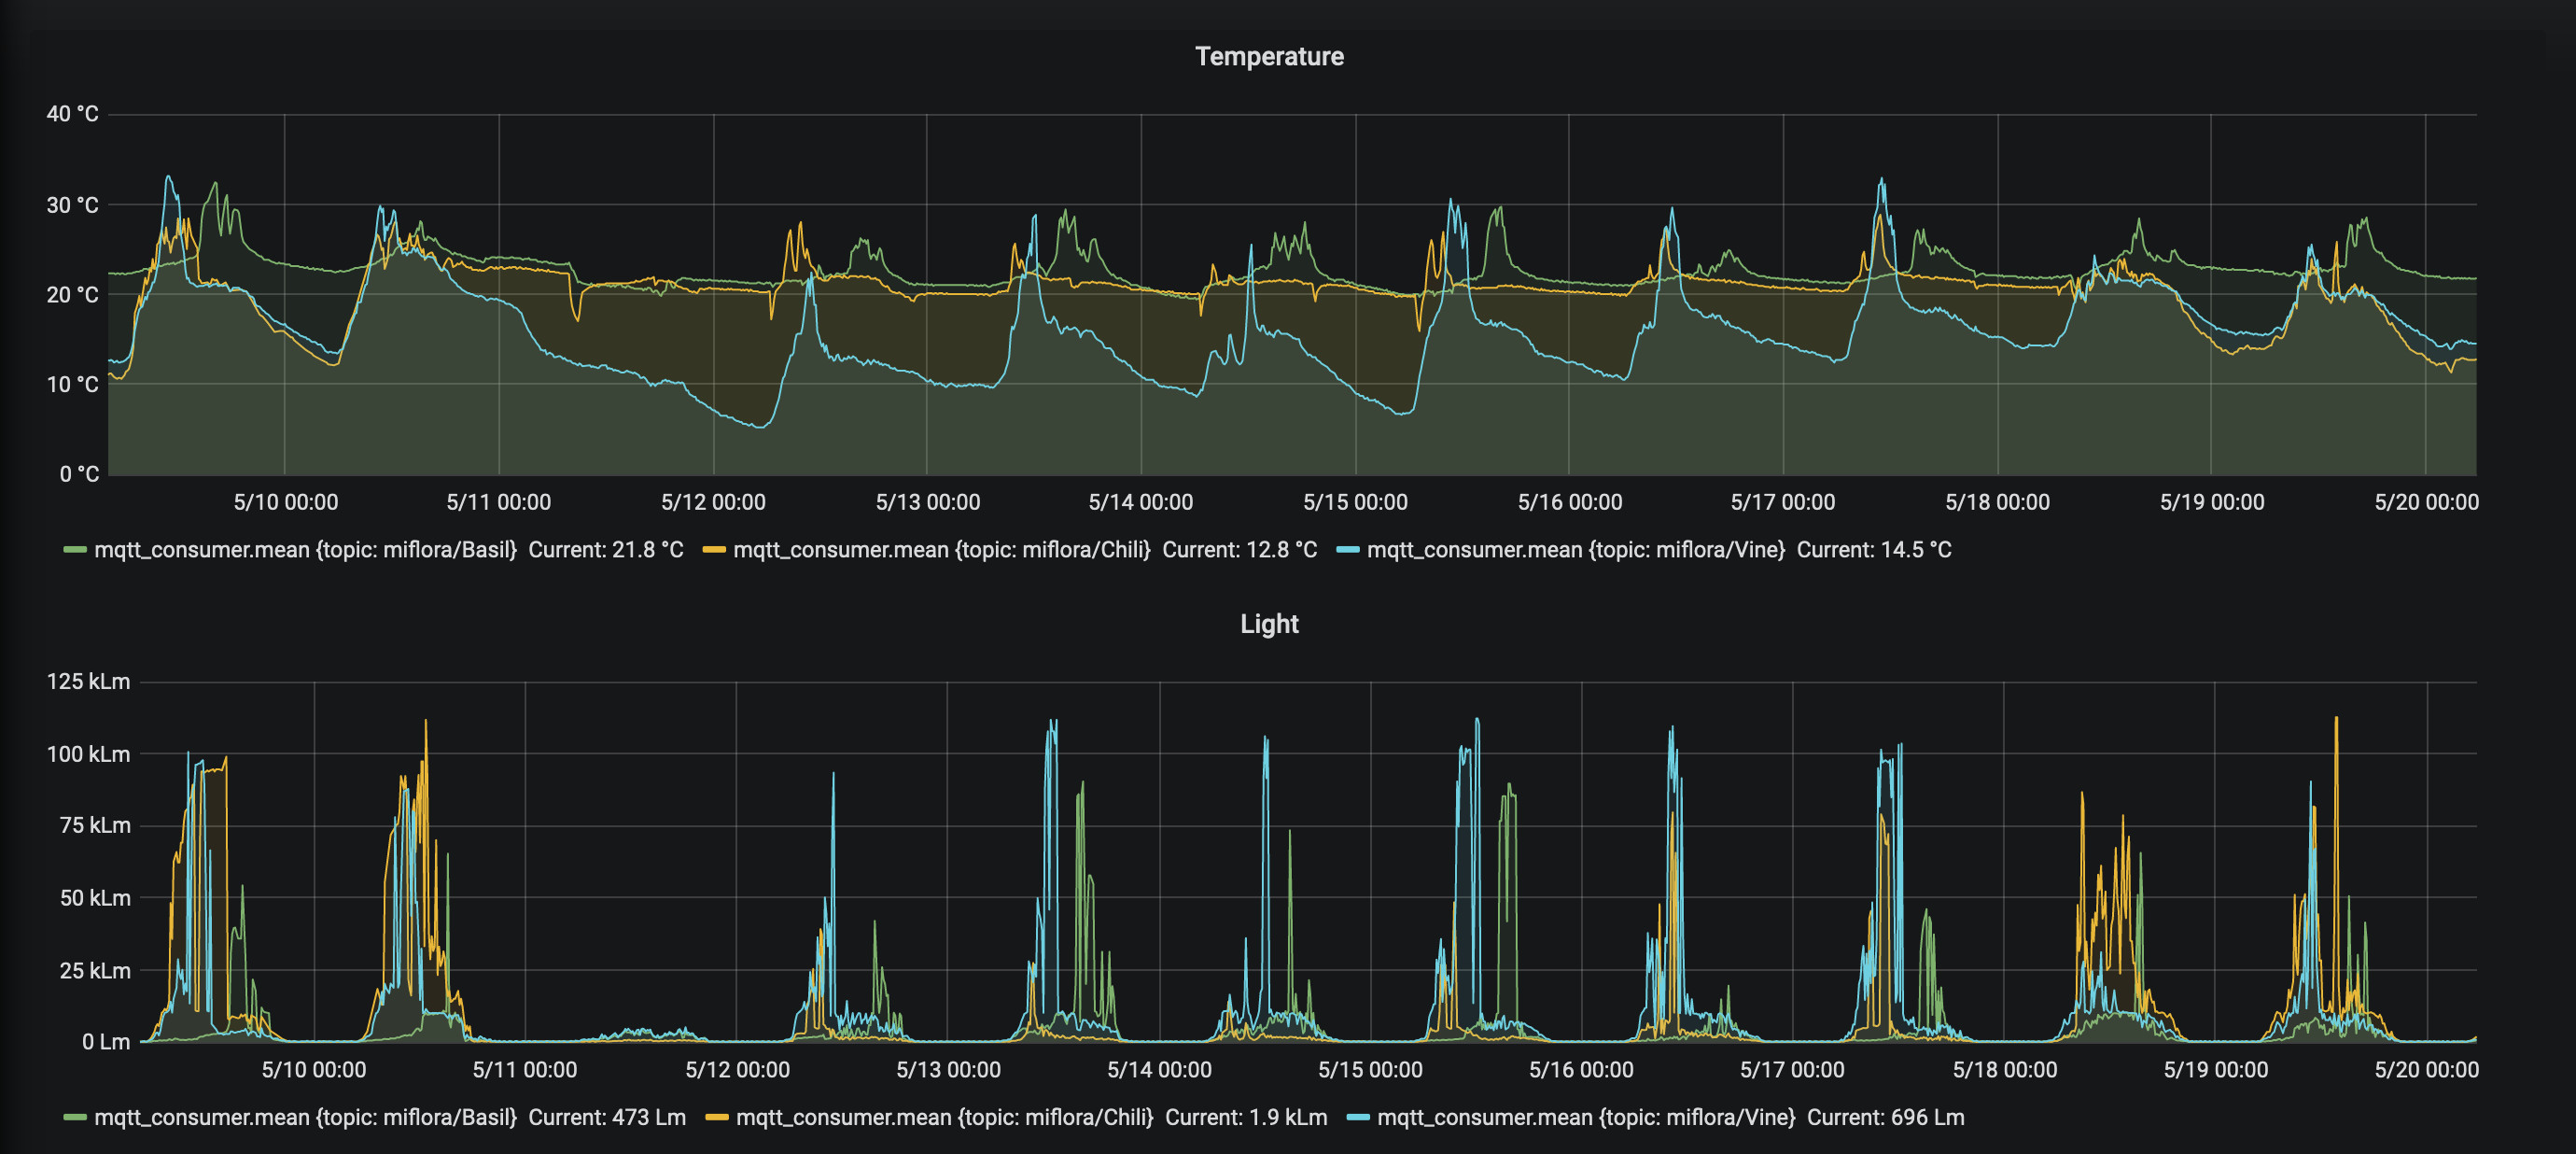
Light and temperature readings seem to be quite accurate and reliable. The first alert I created was on the temperature of the chili plant. This chili plant appeared to not like the cold north European weather too much since the temperature went below 5 °C during some nights. Therefore, I decided to alert myself whenever the chili sensor reads a temperature below 10 °C. This worked very well and was reliable. For a few days in May, I even kept the balcony trough indoors during the daytime for a while because it did not get too warm. This is reflected in the recorded data, see the second picture.
Measured temperature values strongly vary when the sensors are in direct sunlight. I guess this is due to the sensor casing heating up. Therefore, the temperature spikes do not always reflect the actual air temperature. Especially check the data for May, 12. This was a very cloudy day with no direct sunlight. On this day, the measured temperature barely exceeds 20 °C while on other days before and after that, the temperature easily exceeds 30 °C.


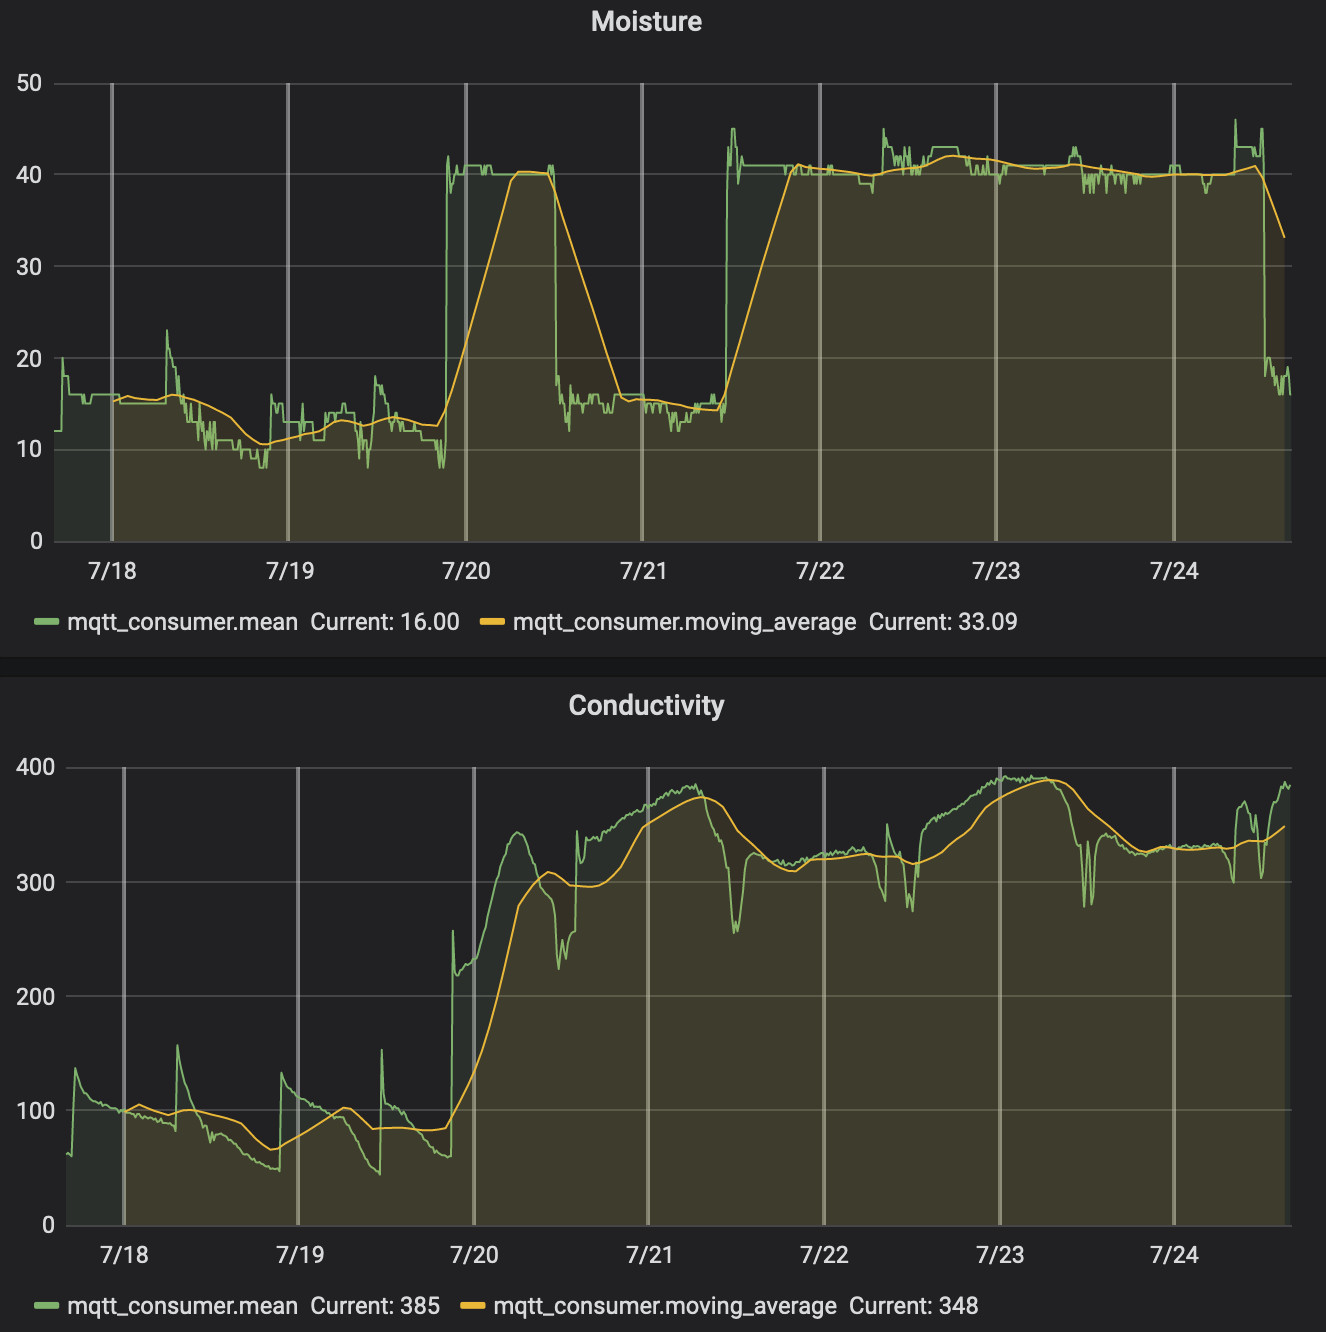
Conductivity & Moisture
The conductivity and moisture readings did not convince me immediately. The moisture sensor readings do not directly respond when a plant was watered. See the second picture in the following set. The plant was not watered for a few days. In the shown period, it was watered first on the 19th in the afternoon. Both moisture and conductivity readings respond immediately. On the next day, the plant was watered once again at lunchtime. This is only reflected by the conductivity reading. I have no idea why the moisture reading drops at that time.
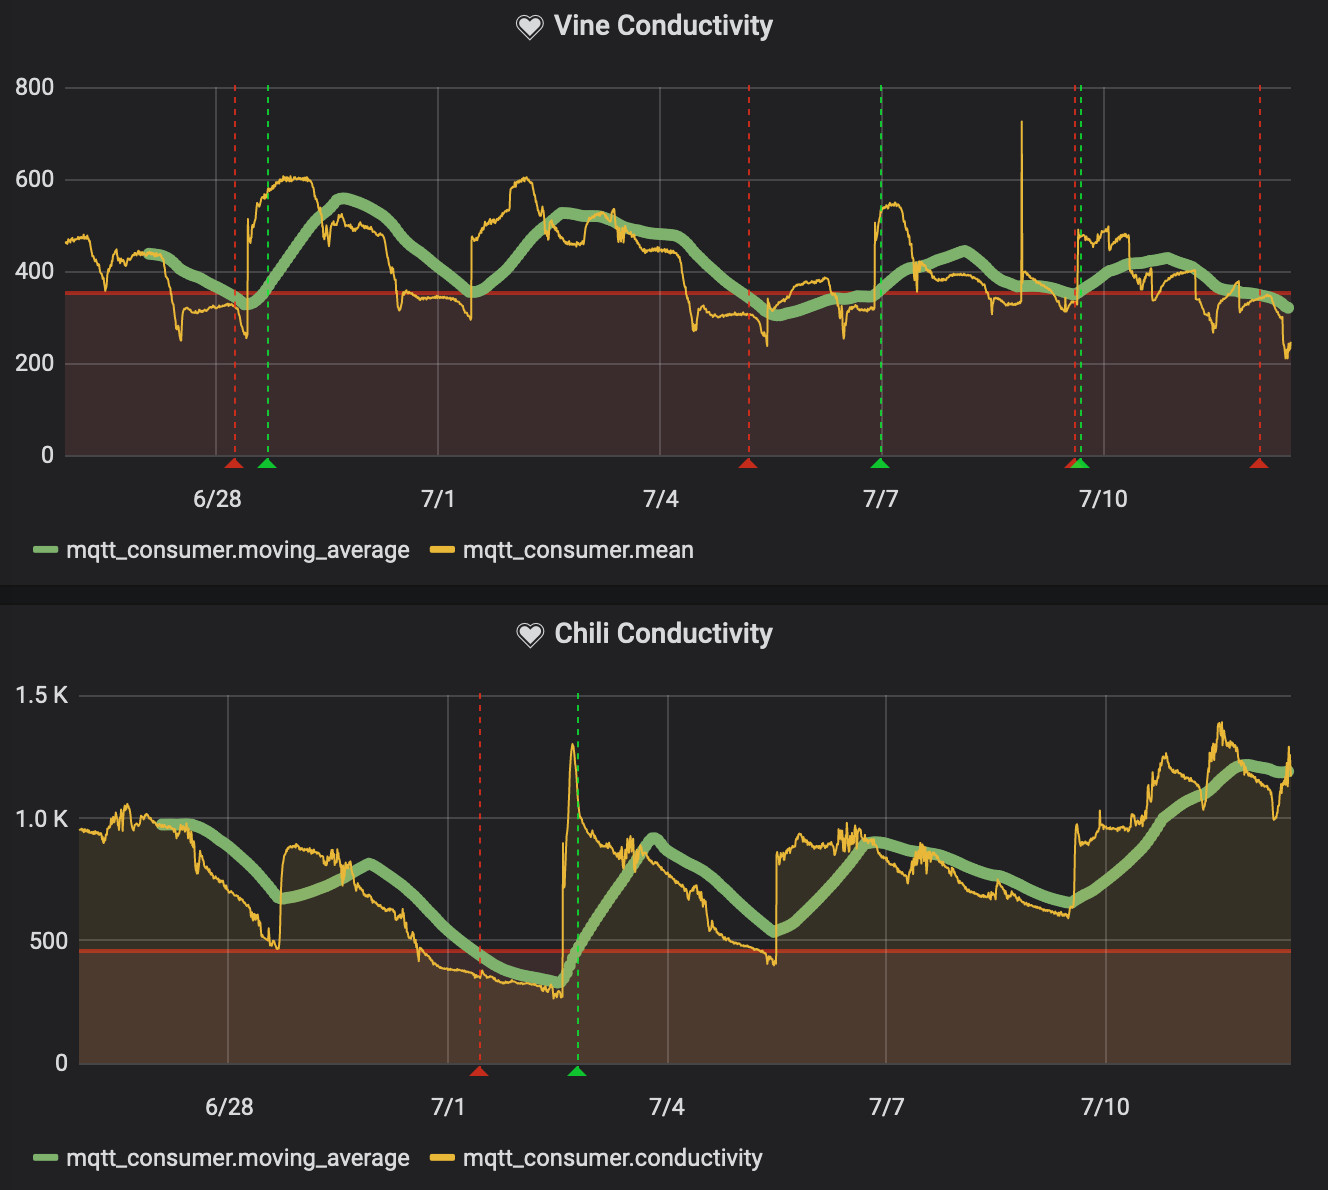
The third picture in the following set shows my current and correctly working water level monitoring based on the conductivity level. Since the conductivity reading varies over the day, the alerting is based on a transformation of the raw data. I found the moving average over 30 hours to be quite stable, but still responsive enough. This transformed value is currently the base for my alerts.


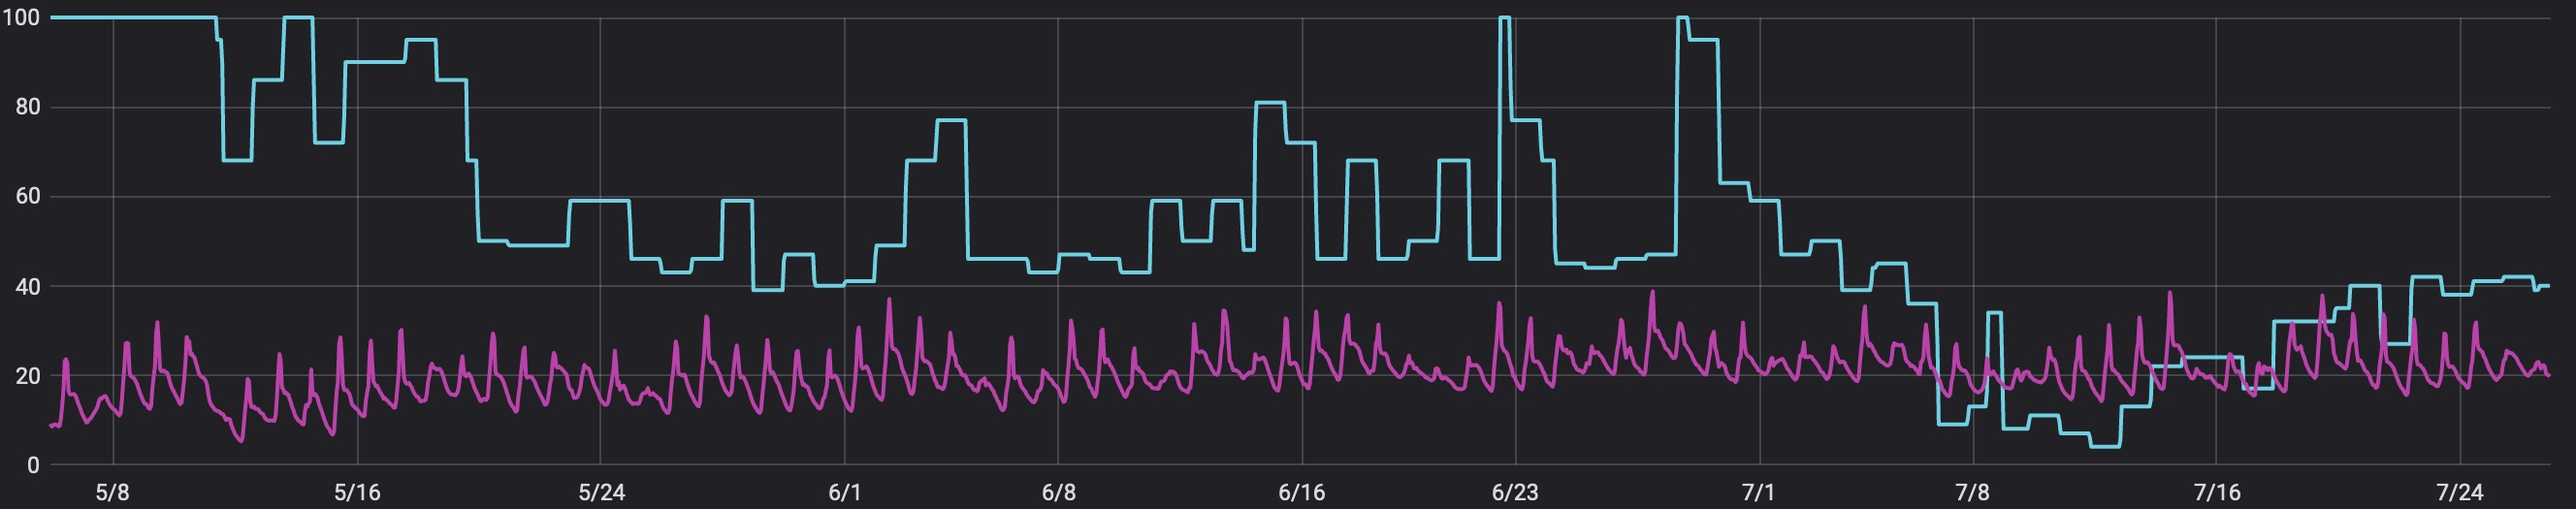
Battery
The period shown in this image is slightly larger, it is about 80 days long. The state of charge reading of the battery in the Vine sensor fluctuates the most among my three sensors. I expect this to be due to the Vine plants outdoor location, mostly unprotected from low temperature (especially mid of May). I added the temperature values of the same sensor to the attached chart to show the relationship between temperature and changes in the state of charge. Especially at the beginning of the shown period, temperature highs and lows line up very well with battery value changes. I assume that those temperature changes have a significant impact on the performance and lifetime of a CR2032 battery.

See also my follow-up post on Replacing a Battery with a Solar Panel and a Super Capacitor.